
Introductions
In our latest whitepaper, Transparent Energy focuses on the NYMEX 12-month forward strip as an essential tool for understanding the trajectory of natural gas prices (and, by extension, electricity prices) and as a compass for guiding energy buyers’ decisions throughout the year. From the influence of record-high U.S. natural gas production to strategic shifts in European gas dynamics, this whitepaper explores the intricacies that shape the future market for energy.
Using January 2024 as the prompt month, this report dissects the factors influencing the recently settled price of $2.561 per MMBtu and puts this price into historical context. Delve into the data, charts, and insights to gain a nuanced understanding of natural gas market drivers, the potential for significant (upside) price fluctuations ahead, and, most importantly, what actions you can take now to affordably power your business.
The 12-Month Strip
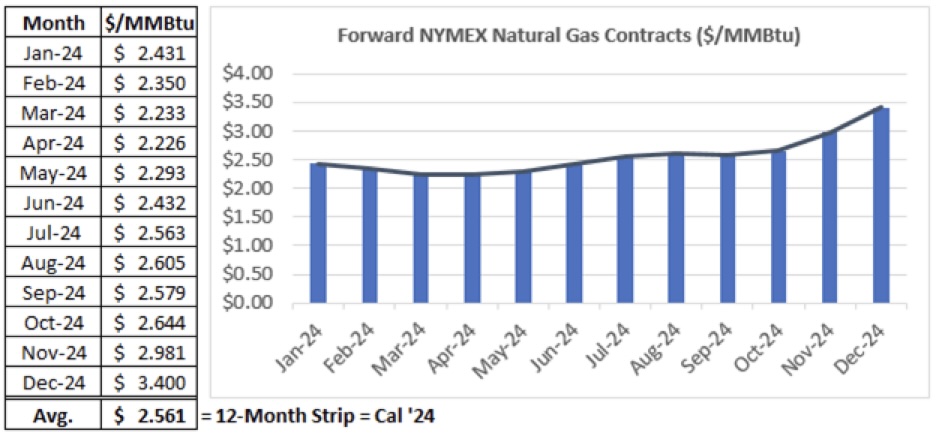
One of the most common ways to evaluate current natural gas prices is to look at the NYMEX 12-month forward strip. The 12-month strip provides a snapshot of where prices are trading for the next calendar year. With January 2024 serving as the prompt month, the current 12-month strip represents an average of the next twelve traded natural gas contracts (January 2024–December 2024).
Because January is the prompt month (and is also the first month of the calendar year), the 12-month strip can also be referred to as Cal ’24, or Calendar Year 2024. Once February 2024 is the prompt month, February 2024-December 2024 will be referred to as Bal ’24 (or Balance of Year 2024), and the 12-month strip would then be February 2024-January 2025.
In addition to the 12-month strip, energy buyers often look at 24-month and 36-month natural gas strips, as well as longer terms. Frequently, we look far into the future at Cal ’25, Cal ’26, etc., and out past Cal ’30.
What the Current 12-Month Strip Shows
As indicated in Figure 1 below, the NYMEX Natural Gas 12-month strip recently settled at $2.561 per MMBtu.
Figure 1. – NYMEX Natural Gas Settlement Prices on Monday, December 11th, 2023
The $2.561 settlement price is significant because it marks the lowest level we’ve seen for the 12-month strip since December 28th, 2020. Additionally:
- Cal ’25 (now trading at $3.377) is at its lowest level since March 2, 2022.
- Cal ’26 (now trading at $3.645) is at its lowest level since March 28, 2022.
- Forward strips out to 2030 are all trading at or close to multi-year lows.
If we look at Figure 2 below, the average NYMEX settlement price over the past 10 years is $3.366 per MMBtu. The current 12-month strip price of $2.561 is lower than eight of the past 10 years.
Figure 2. – NYMEX Natural Gas Annual Average Settlement Price
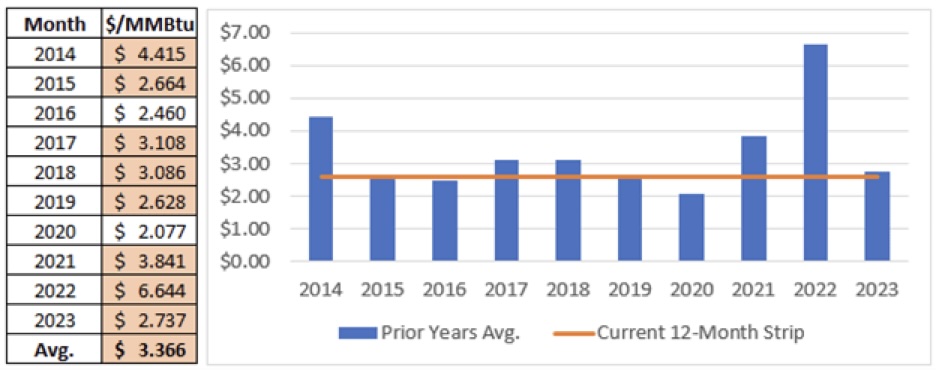
Note: The highlighted numbers above indicate years when the annual average NYMEX Natural Gas price settled above today’s $2.561 per MMBtu forward strip for 12-months.
Why Have Natural Gas Prices Dropped?
- The 2022-2023 winter (December through February) was the fourth warmest winter on record. The mean temperature was 34.0°F, which was 6.5 degrees above the 130-year average and 4.3°F warmer than the 30-year average. This led to a sharp drop in residential and commercial demand for natural gas.
- U.S. natural gas production established new record highs in 2023. After averaging 99.6 Bcf per day in 2022, production is expected to exceed 104 Bcf per day in 2023 and rise to more than 105 Bcf per day in 2024.
- As a result of lower res/com demand for natural gas and the increase in domestic production, U.S. natural gas inventories rose from a deficit of 367 Bcf vs. the 5-year average in August 2022 to a surplus of 378 Bcf by March 2023.
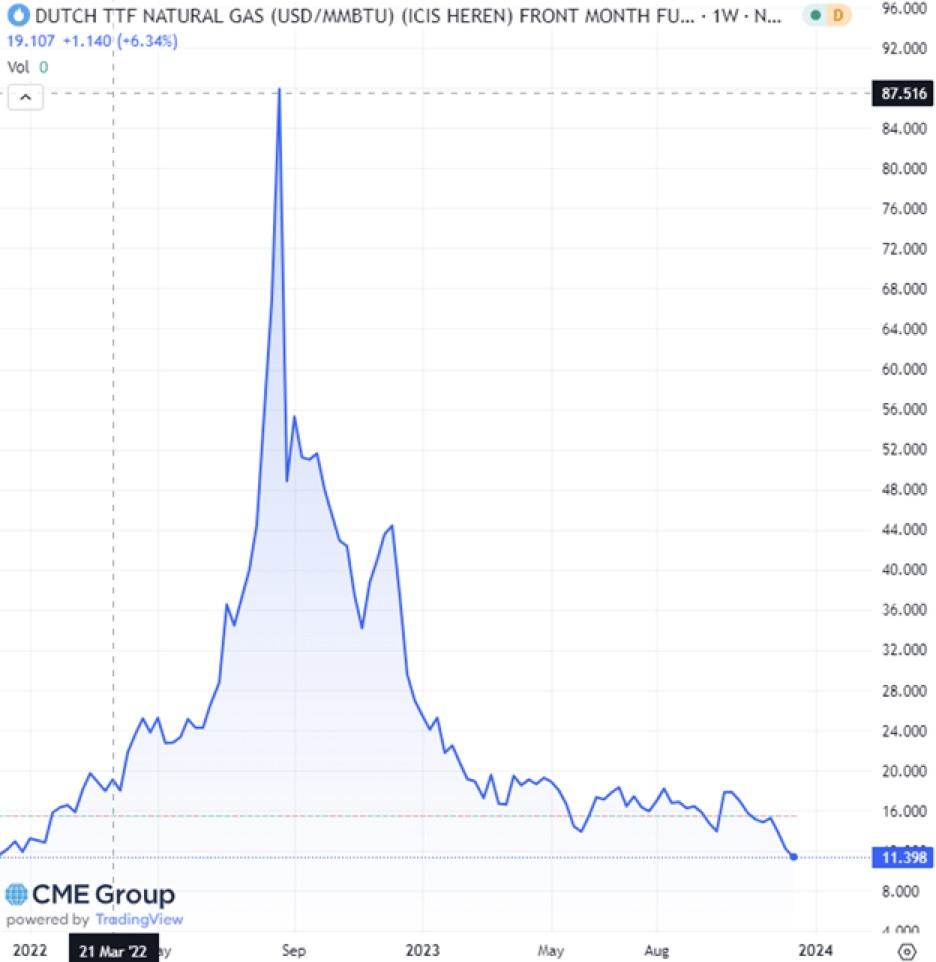
- European natural gas prices dropped from a high of more than $90 per MMBtu in August 2022 to below $12 per MMBtu in December 2023. The decline in prices was the result of a warm winter across the continent and lower demand across the industrial and res/com sectors. Storage inventories are nearly full entering the winter of 2023/2024 as European countries have effectively weened themselves off the need for Russian pipeline gas. (See Figure 3 below for a historical look at Dutch TTF prices, the benchmark for European natural gas).
- ExxonMobile announced a delay in the startup of its Golden Pass LNG export terminal along the Gulf Coast. This facility was expected to begin exporting 2.4 Bcf/d beginning in the second half of 2024. The start date has been pushed back to the first half of 2025. This 6-month delay is expected to add nearly 200 Bcf of unexpected gas to storage.
- The winter of 2023-2024 is off to a slow start, with warmer-than-normal temperatures expected for the majority of December. Looking ahead to the rest of the winter, an El Nino pattern is emerging, which is typically associated with warmer, dryer conditions across the northern two-thirds of the continental U.S.
Figure 3 – Dutch TTF Front Month Natural Gas Prices
Is Now an Ideal Time to Procure My Next Electricity or Natural Gas Contract?
Yes! While market fundamentals continue to show signs of bearishness, the potential for prices to move substantially higher outweighs the limited opportunity to the downside. As we advised clients for most of the 2010s and into the 2020s, “You Won’t Get Hurt Falling out the Basement Window.” We do not know how much lower prices can go, but we know that at current price levels, natural gas producers find less incentive to maximize production.
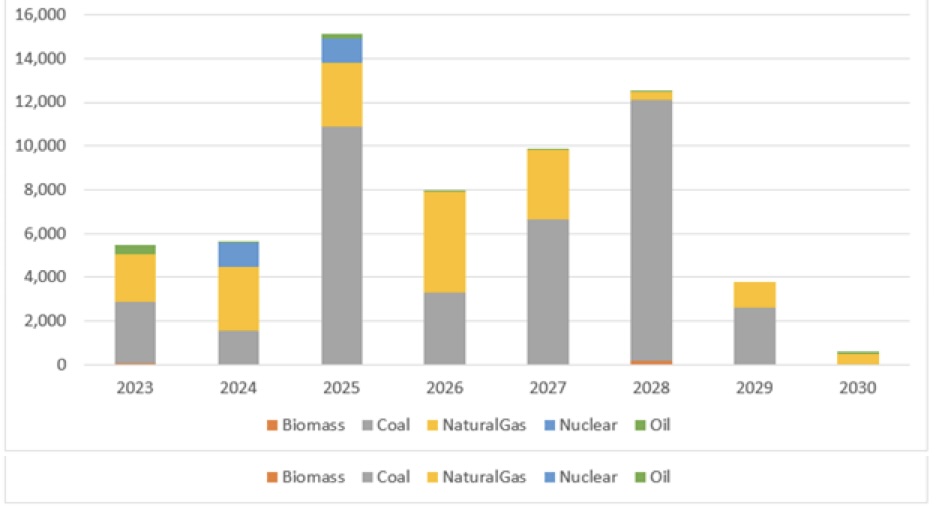
One reason to expect natural gas prices to revert higher is that state and federal governments are enacting greenhouse gas emission reduction targets. These clean energy standards are changing the dynamics of electricity pricing while also helping to foster all-time demand for natural gas in the power generation sector. Coal-fired capacity is being retired at an average rate of more than 11 GW per year since 2015. In 2005, coal accounted for 50% of all electricity generated in the U.S. That number today is below 19%. Figure 4 below shows planned electric generation retirements over the next several years.
Figure 4 – Planned U.S. Electric Power Plant Retirements
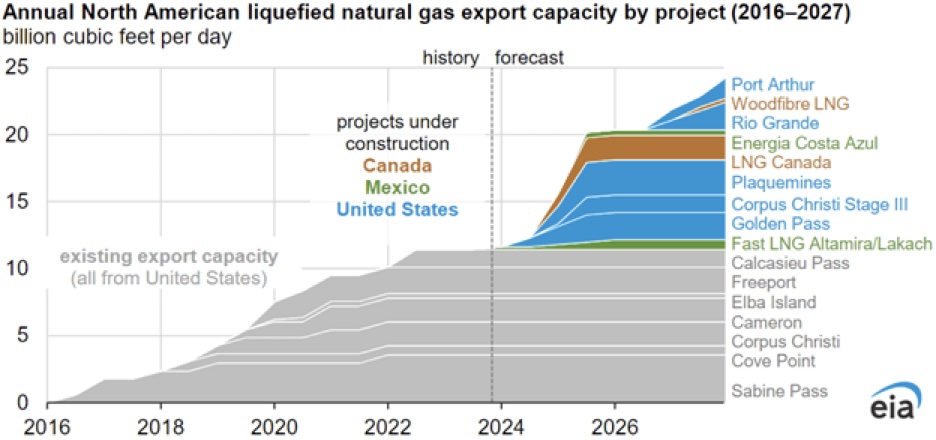
Despite the delayed start of the Golden Pass LNG export terminal, several other facilities are in various phases of construction and preparing to send liquified natural gas to foreign markets (particularly Europe and Asia). Figure 5 below shows the planned timeline, which will nearly double U.S. LNG export capacity by the end of 2026.
Figure 5 – Planned LNG Export Capacity Growth
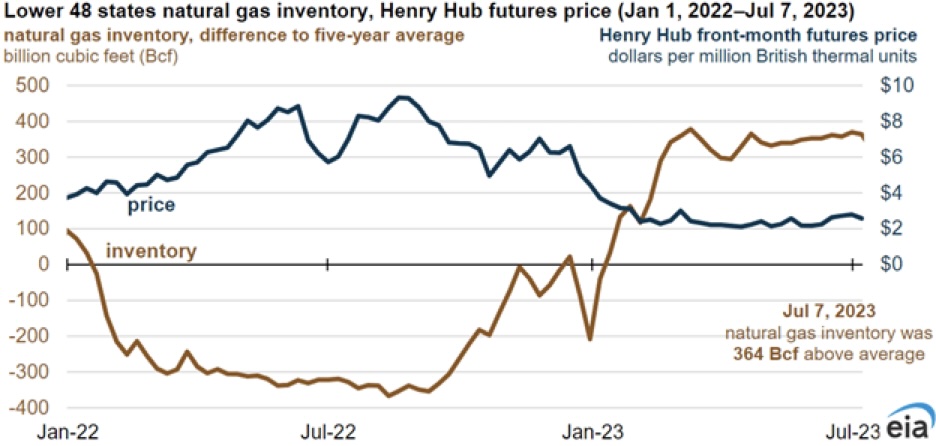
Every Bcf of natural gas that is sent overseas is a Bcf that does not get injected into U.S. storage reserves. As we saw as recently as the summer of 2022, a deficit in natural gas storage vs. prior years leads to higher prices. Figure 6 below demonstrates this inverse correlation.
Figure 6. – U.S. NG Storage Deficit/Surplus vs. 5-Year Avg. as Compared to NG Prompt Month Price
Today offers a near-perfect storm of low-cost energy conditions:
- Mild winter weather.
- Strong natural gas production.
- Lower prices overseas.
Conditions that could send prices substantially higher:
- Any extended period of below-normal temperatures, especially in large population centers.
- Continued or expanded efforts to eliminate fossil fuel electric generation.
- LNG export capacity meeting or exceeding planned growth trajectory.
- Economic turnaround in European and/or Asian markets.
While there are certainly factors that could move prices in either direction, we believe that the risk to the upside is much greater than the opportunity cost to the downside. Just last year, prompt-month prices settled at $9.353 per MMBtu in September 2022. That is more than 4x current prompt month prices.
Figure 7 below shows the 12- and 24-month natural gas price strips over the past 3 years. Gas costs have reverted to near the historic lows of the prior decade.
Figure 7. – 12 and 24-Month Natural Gas Price Strips ($/MMBtu)
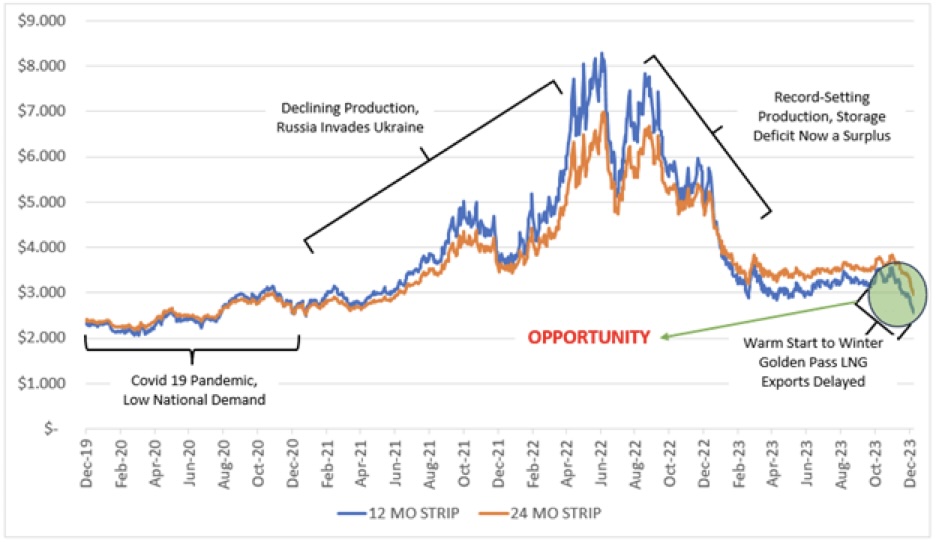
The key takeaway is that natural gas prices are approaching all-time lows. While much of the downward movement has been focused on the front of the curve, there have also been significant decreases in pricing for 2025-2030. The market is presenting an opportunity to secure low-cost, fixed-price energy several years into the future.
Categories:
More on News & Releases
-
The New Energy Frontier: Autonomous Procurement, AI, and Corporate Sustainability
10.17.24
Join Len DeCandia, former CPO of Johnson & Johnson, and Paul Shagawat, Co-founder of Transparent Energy, for an engaging fireside chat on how automation, AI, and sustainability are reshaping energy...

-
Buyer Beware: Electricity Contracts Are Increasingly Complex – Let Transparent Energy Help Clarify
10.03.24
By Brendan Boyle, Director, Market Intelligence, Transparent Energy, October 2024 Introduction At the Transparent Energy Market Intelligence desk, we focus a lot of our attention on the wholesale electricity and...
-
Energy Budgeting is More Difficult (and Critical) Than Ever – Transparent Energy Can Help
09.19.24
By Brendan Boyle, Director, Market Intelligence, Transparent Energy, September 2024 With Labor Day in the rearview mirror, businesses are focused on finishing the year strong while planning for both next...