
On April 4, Colorado State University released its preliminary 2024 hurricane season forecast for the Atlantic basin, which runs from June 1st through November 30th. CSU has been issuing these reports since 1984, and each year they update their April forecast throughout the summer as climate conditions evolve. Here is a look at this year’s initial forecast:
| Forecast Parameters | CSU 2024 Forecast | 2023 Observed | Avg. for 2000-2023 |
| Named Storms | 23 | 20 | 16.3 |
| Named Storm Days | 115 | 99 | 75.1 |
| Hurricanes | 11 | 7 | 7.6 |
| Hurricane Days | 45 | 31 | 26.9 |
| Major Hurricanes | 5 | 3 | 3.4 |
| Major Hurricane Days | 13 | 8 | 7.9 |
| Accumulated Cyclone Energy* | 210 | 157 | 129.2 |
*A measure of a storm’s potential to cause damage quantified as the sum of the square of a named storm’s maximum wind speed for each 6-hour period of its existence.
A quick scan of this chart shows an increase in every forecast parameter. So what does the possibility of more storm activity mean to you and your business? We’ll get to that, but first a deeper dive into how hurricanes work.
Hurricane Origins
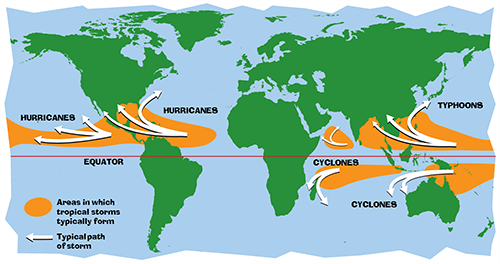
A developing cyclone rotates counterclockwise in the Northern Hemisphere and starts out as a Tropical Depression. Once the storm reaches sustained winds of 39 MPH, it receives a name from a list maintained by the World Meteorological Organization and will then fall into one of these categories:
- Tropical Storm: maximum sustained winds of 39 to 73 MPH
- Hurricane: maximum sustained winds of 74 MPH or higher and rated from 1 to 5 based on the Saffir-Simpson Hurricane Wind Scale:
- Category 1 = 74 to 95 MPM – very dangerous
- Category 2 = 96 to 110 MPH – extremely dangerous, harmful winds
- Category 3 (major hurricane) = 111-129 MPH – devastating damage
- Category 4 (major hurricane) = 130 – 153 MPH – catastrophic destruction
Atlantic hurricanes form over the ocean, typically as a tropical wave when water temperatures are above 79° F. Westward winds blowing across the ocean from Africa provide fuel for the storm as water evaporates and rises forming large cumulonimbus clouds. Given enough favorable ocean and atmospheric interactions, the wave will develop into a tropical disturbance, a tropical depression, tropical storm, and finally a hurricane. A typical hurricane will be around 300 miles wide with a calm eye in the middle, usually 20-40 miles across. Each summer and autumn, these storms bring hazardous conditions wherever they make landfall.
What does this have to do with energy markets?
Prior to the shale revolution, a hurricane arriving in the Gulf of Mexico would typically send natural gas prices higher as key offshore drilling platforms and rigs would be shut down for weeks or months at a time. Recent hurricanes have had a minimal impact on total U.S. supply of natural gas due to the substantial growth in onshore production. The total share of U.S. natural gas production from the Gulf was below 2% in 2023, substantially lower than 13% in 2005 when Hurricanes Rita and Katrina shut in nearly all production in the Gulf of Mexico:
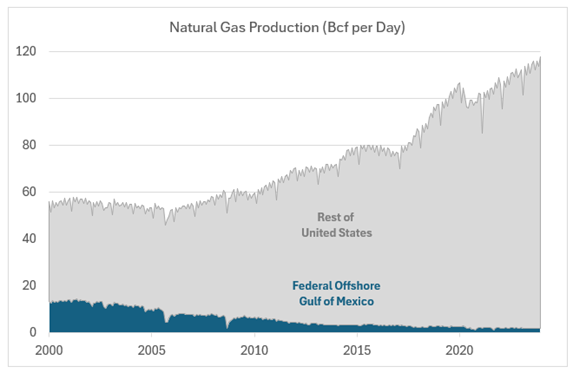
Source: U.S. Energy Information Administration
Should there be robust hurricane activity in the Gulf this summer, the energy price impact will be felt most dramatically in the oil and gasoline markets. In 2023 over 14% of U.S. crude oil production came from offshore drilling in the Gulf of Mexico. Combined with the potential loss of refining capacity, the EIA estimates that a prolonged outage would send retail gasoline prices higher by at least $0.25-$0.30 per gallon.
While a major hurricane may not substantially affect U.S. natural gas supply or prices, global markets would likely be impacted due to the fast-growing importance of liquified natural gas (LNG). While LNG terminals along the Gulf Coast are built with multiple levels of protection, major storms have caused damage to electrical and marine infrastructure while limiting the movement of carriers. A sustained interruption to U.S. LNG shipments would likely have a strong bullish influence on global gas prices. As recently as 2022, the shutdown of Freeport LNG (which accounted for ~10% of European gas imports) sent shockwaves through international gas markets:
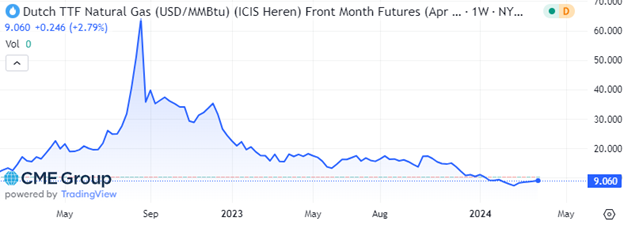
The price impact of the Freeport outage was exacerbated by the Russia-Ukraine war, higher coal prices, and supply chain issues that slowed production growth. European nations scrambled to find new energy supplies ahead of the winter, and global prices responded accordingly.
Domestically, hurricanes are more often seen as a bearish signal for natural gas prices, as electricity outages cause a drop in consumer demand and LNG feedgas that would otherwise be liquified and sent overseas is placed into inventory until ships can resume their exports.
The CSU projection model is among the most respected in the world of meteorology. It provides guidelines for the frequency and intensity of the upcoming storm season, and their revised projections typically increase in accuracy as the summer approaches. Even the best forecasts cannot predict some of the most crucial factors: where will the storm make landfall, and at what speed will it move? Hurricanes that strike population centers and those that move slowly, dropping feet of rain over low-lying areas, tend to be among the most disastrous.
Why is this hurricane season expected to be more active than usual?
CSU asserts that emerging La Niña conditions later this summer are likely to create “favorable wind shear” and that a “warmer-than-normal tropical Atlantic provides a more conducive dynamic and thermodynamic environment for hurricane formation and intensification…the forecast is based on an extended-range early April statistical prediction scheme that was developed using ~40 years of past data.”
So what does this all mean to you?
As mentioned above, today’s hurricanes are a bearish indicator for natural gas and electricity prices in the U.S. due to demand destruction and the potential to slow LNG exports from our terminals. They also introduce further volatility to the markets. In the leadup to, and aftermath of, earlier hurricanes, we’ve seen near-term prices move more than 10% in both directions over just a few days. Energy market participants (suppliers, producers, traders) expecting a major storm will often drive prices lower. Should the storm change direction, or cause less damage than expected, prices will quickly revert higher.
The university will be publishing a revised forecast on June 11th. Transparent Energy will be available with updates throughout the season and here to discuss any potential energy cost impacts for your business. In the meantime, stay safe out there!
Categories:
More on News & Releases
-
The New Energy Frontier: Autonomous Procurement, AI, and Corporate Sustainability
10.17.24
Join Len DeCandia, former CPO of Johnson & Johnson, and Paul Shagawat, Co-founder of Transparent Energy, for an engaging fireside chat on how automation, AI, and sustainability are reshaping energy...

-
Buyer Beware: Electricity Contracts Are Increasingly Complex – Let Transparent Energy Help Clarify
10.03.24
By Brendan Boyle, Director, Market Intelligence, Transparent Energy, October 2024 Introduction At the Transparent Energy Market Intelligence desk, we focus a lot of our attention on the wholesale electricity and...
-
Energy Budgeting is More Difficult (and Critical) Than Ever – Transparent Energy Can Help
09.19.24
By Brendan Boyle, Director, Market Intelligence, Transparent Energy, September 2024 With Labor Day in the rearview mirror, businesses are focused on finishing the year strong while planning for both next...