By Brendan Boyle, Director of Market Intelligence, Transparent Energy, September 2026
Even the most seasoned procurement managers and energy advisors will acknowledge that it is nearly impossible to predict which direction energy prices are headed. There are, however, certain fundamental factors that provide relatively stable guidance:
- Energy supply tends to plod along based on the implementation of drilling rigs and construction of new power plants. These are projects that take a long time to deploy and can be accounted for when examining the forward price curve. Only a significant technological breakthrough (like the advent of fracking) tends to meaningfully alter the course of supply over a short timeframe.
- Energy demand typically follows a predictable seasonal pattern that ebbs and flows based on the annual heating and cooling needs of different regions. The recent explosion in data center development and the buildout of the U.S. LNG export fleet have added a wave of upward momentum to the forward demand curve, which has been a big factor in the recent uptick in electricity prices across several parts of the country.
Then there are other elements that are less predictable that tend to have a more fluid bearing on markets:
- Geopolitics and other unforeseen factors often escalate quickly and without warning. In this decade alone, we’ve seen the aftermath of the Covid-19 pandemic (bearish), the Russo-Ukraine war (bullish), an oversupply crash following consecutive warm winters and record-setting production (bearish), and the ongoing conflict in Iran (bullish).
- Weather is the other variable that can drive swift changes to energy prices, in both the near and longer terms as it drives both supply and demand. Temperature forecasts and the expectation of damaging storms are arguably the primary drivers of energy prices on a day-to-day basis.
What Is the Weather Forecast Telling Us?
Typical weather forecasts provide a moderately reliable estimate for temperatures and precipitation one or two weeks into the future. Energy prices are quick to react to changes in the near-term forecasts that shape domestic heating and cooling needs.
When we look at long term climate history, there are certain metrics that allow meteorologists to predict weather trends over a much longer timeframe. A primary area of focus for climate scientists lies in the surface temperature of Pacific Ocean waters over a wide area west of South America. When these sea temperatures trend above normal, an El Niño climate pattern emerges. During El Niño, Pacific trade winds weaken. Warm water is pushed east toward the west coast of the Americas, significantly impacting weather. The warm waters cause the jet stream to move south of its usual position. With this shift, areas in the northern U.S. and Canada tend to be drier and warmer than usual while the Gulf Coast and Southeast are wetter with increased flooding.
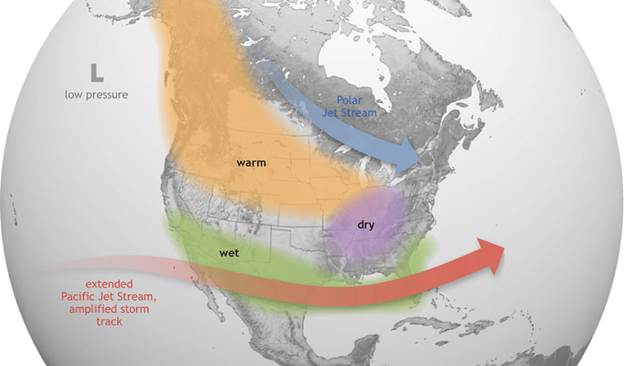
Source: NOAA
El Niño conditions typically occur every 7-10 years, and last for between 9-12 months. While El Niño has global implications, its climate impact shows up mostly during winter months over North America.
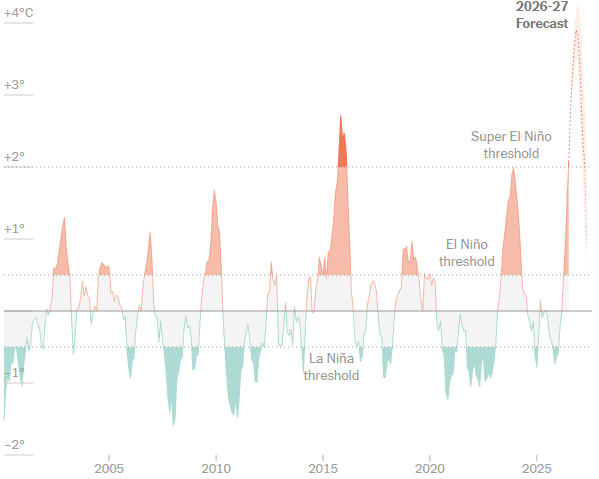
On August 22nd, sea surface temperatures in the El Niño zone measured 85.0° F, higher than any time on record. Forecasts are calling for the current El Niño to emerge stronger this winter than ever before. Both government and private sector forecasts are calling for the winter of 2026/27 to rank among the five warmest in the lower 48 states dating back to 1950.
The chart below shows sea surface temperature anomalies in the El Niño region compared to a 10-year baseline average:
Source: New York Times via The Climate Brink
What Does This Mean for Energy Prices?
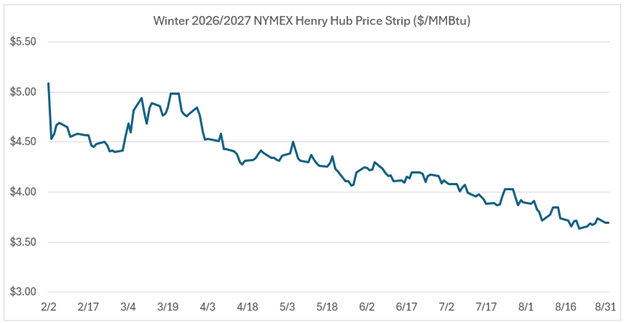
The warmer outlook is well correlated with weakness in winter NYMEX natural gas pricing. Since February 2nd, the Dec ’26 – Feb ’27 Henry Hub strip has dropped 27.4%:
This bearishness from a national perspective isn’t reflected uniformly across regional markets. Pipeline constraints in the Northeast have kept winter basis prices elevated at the Algonquin Citygate (New England) and Transco Zone 6 New York:
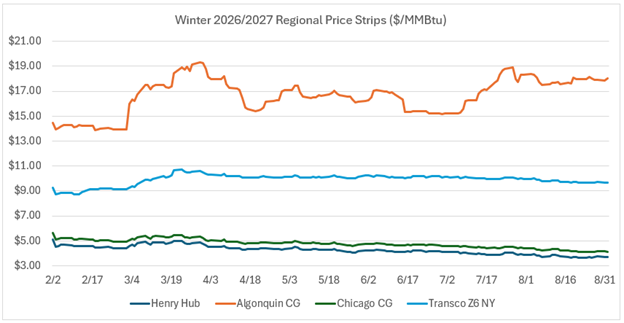
It’s important to remember that while a strong El Niño is often associated with warmer winter temperatures nationally, seasonal outlooks represent a shift in likelihood of outcomes vs. normal conditions as opposed to individual cold outbreaks. As we saw last winter, even a few days of extreme cold caused by a winter storm can send shockwaves across national gas and power markets.
What This Means for Your Procurement Strategy
The fact that the upcoming winter NYMEX gas strip is trading below $3.60 per MMBtu presents a strong buying signal for unhedged natural gas customers (i.e., those who have not fixed the price of some, or all, of their natural gas positions). Strong domestic production, healthy inventories, and the warmer-than-normal winter forecast combine to keep prices in check. Over the past 5 years, winter gas prices have averaged $4.34 per MMBtu (15% higher than today’s prices), and as recently as February 2026, Henry Hub gas settled at $7.46 per MMBtu.
For a business using 50,000 dekatherms during the winter, hedging 50% of your forward gas costs today could save $20,000 vs. previous winters.
A sound strategy would be to hedge a portion of the upcoming winter at today’s low prices and establish a “trigger” to lock in the balance of winter in the event prices move even lower. Winter volatility has increased in recent years across both natural gas and electricity markets. A single Arctic outbreak or an unforeseen event could cause prices to increase sharply. Don’t be left out in the cold: Now is a great time to act and protect against higher costs.
###
If you are interested in learning more about seasonal impacts on energy pricing and/or developing a procurement strategy that reduces risk and cost this El Niño season and beyond, contact Transparent Energy at LetsTalk@transparentedge.com.
Download article as PDFCategories:
More on News & Releases
-
More Leverage, Less Friction – Using Technology and Competition to Strengthen Energy Procurement
10.22.26
How confident are you that your electricity and natural gas bids reflect the best pricing suppliers are willing to offer? Join Transparent Energy co-founder Paul Shagawat to explore how a...

-
A Beautiful Buying Opportunity: Forward Natural Gas Prices Fall to Multi-Year Lows
10.19.26
By Brendan Boyle, Director of Market Intelligence, Transparent Energy Record Production, Growing Demand On September 17, 2026, U.S. dry natural gas production set a record of 113.7 billion cubic feet...
-
Underserved No Longer: How Transparent Energy is Helping Educators Excel at Energy Procurement
10.14.26
By Paul Shagawat, Co-Founder and Managing Partner, Transparent Energy A Costly Disconnect Educational institutions, whether pre-K facilities, K-12 Boards of Education or school districts, preparatory or technical schools, community colleges,...